
Graphics-card performance ladder
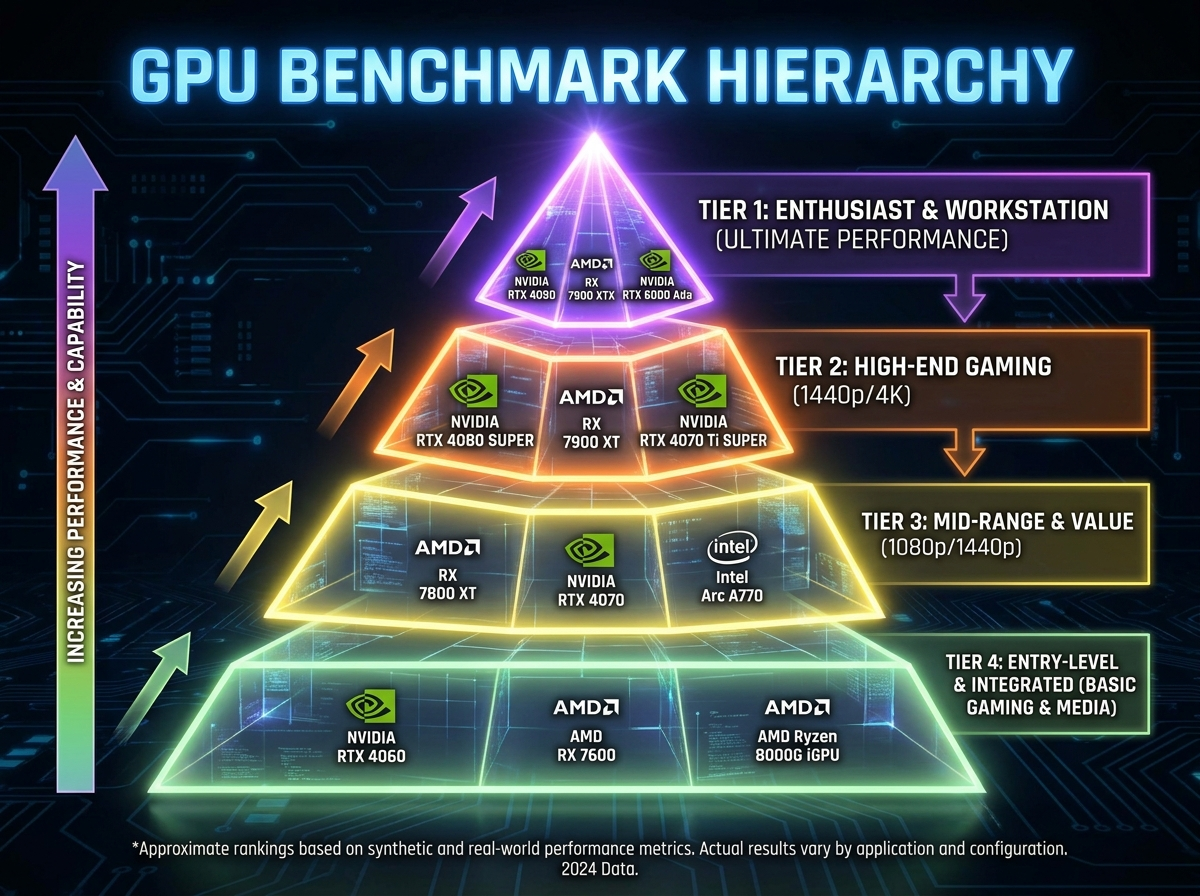
GPU Benchmark Hierarchy
This hierarchy organises graphics cards into practical buying tiers for Australian gamers and creators. Resolution, ray tracing, VRAM, creator software, power, warranty and current AUD pricing all shape the final ranking.
This page is an editorial class map, not a substitute for current measured results. Dedicated benchmark pages should provide test systems, dates, sources and exact performance data.
Quick answer
A GPU hierarchy should guide the shortlist, not replace the final comparison
Use the hierarchy to identify the class of graphics card that fits your monitor and workload. Then compare specific models using game benchmarks, ray-tracing results, creator software, power, warranty and current Australian pricing.
The best hierarchy explains why a card belongs in a class and when a lower tier may still be the better purchase.
Animated performance ladder
How to read the hierarchy
Move up the ladder when the monitor, settings or workload can use the extra performance. Stop when the next tier adds cost without changing the experience you care about.
- Value 1080p: entry gaming, older cards and tight budgets.
- High-refresh 1080p: stronger mainstream cards and esports builds.
- Mainstream 1440p: the broad sweet spot for modern gaming.
- Premium 1440p: high settings, ray tracing and flexible 4K.
- High-end 4K: demanding 4K and mixed creator work.
- Extreme 4K: specialist builds where maximum performance matters most.
Editorial performance classes
GPU benchmark hierarchy by buyer tier
These model examples show which cards belong in the conversation for each class. They are not presented as exact measured rankings.
Extreme 4K and specialist
Built for buyers chasing the highest available performance, heavy ray tracing, local AI or demanding creator work.
- Model example: RTX 5090
- Best for: extreme 4K and specialist workloads
- Main caution: weak value for ordinary gaming
High-end 4K
Strong 4K-first cards for premium gaming, ray tracing and mixed creator workloads.
- Model example: RTX 5080
- Best for: 4K-first systems
- Main caution: total build cost
Premium 1440p and flexible 4K
High-end options for strong 1440p, ray tracing and flexible 4K without climbing to the extreme tier.
- Examples: RTX 5070 Ti, RX 9070 XT
- Best for: premium 1440p
- Main caution: compare features and AUD price
Mainstream 1440p
The core performance class for buyers balancing high settings, VRAM, features and total system cost.
- Examples: RTX 5070, RX 9070
- Best for: 1440p gaming
- Main caution: price gap to premium tier
High-refresh 1080p and entry 1440p
Modern mainstream cards for fast 1080p, lighter 1440p and balanced gaming PCs.
- Examples: RTX 5060 Ti, RX 9060 XT
- Best for: high-refresh 1080p
- Main caution: exact memory version
Value 1080p and used market
Cards for budget systems, older builds and buyers willing to trade features or warranty for lower cost.
- Examples: RTX 5060, RTX 4060, RTX 3060 12GB
- Best for: value-focused 1080p
- Main caution: age, VRAM and warranty
Hierarchy logic
What can move a GPU up or down?
A single average-FPS score is not enough to place a card for every buyer.
Factors that raise practical value
- Strong low-frame behaviour
- Enough VRAM for the target workload
- Useful ray-tracing and upscaling support
- Good creator-software compatibility
- Reasonable power and cooling needs
- Competitive Australian pricing
Hierarchy weight by decision
Hierarchy reference table
GPU performance tiers at a glance
| Tier | Typical target | Examples to compare | Main strength | Main caution |
|---|---|---|---|---|
| Extreme 4K | Maximum 4K, AI and specialist work | RTX 5090 class | Highest available headroom | Price and total-system cost |
| High-end 4K | Premium 4K and ray tracing | RTX 5080 class | Strong 4K-first fit | Premium pricing |
| Premium 1440p | High-refresh 1440p and flexible 4K | RTX 5070 Ti, RX 9070 XT | Excellent gaming balance | Feature and price differences |
| Mainstream 1440p | Modern 1440p gaming | RTX 5070, RX 9070 | Broad sweet spot | Premium-tier price gap |
| High-refresh 1080p | Fast 1080p and entry 1440p | RTX 5060 Ti, RX 9060 XT | Balanced mainstream value | Memory configuration |
| Value 1080p | Budget gaming and older systems | RTX 5060, RTX 4060, RTX 3060 | Lower entry cost | Age, warranty and settings limits |
What is a GPU benchmark hierarchy?
A GPU benchmark hierarchy is a practical performance ladder. It groups graphics cards by the kind of gaming or creator experience they can deliver. A useful hierarchy is more than a list sorted by one average score.
It should explain the target resolution, settings, ray tracing, VRAM, creator support, power, warranty and price context behind each class.
Why generation names can mislead buyers
A newer mainstream card does not automatically outperform an older higher-tier card. Product tier often matters more than the first digit in the model name.
That is why comparisons such as RTX 4070 vs RTX 5060 are useful. The older card may offer more raw tier-level performance, while the newer card may offer a better warranty path, efficiency or feature support.
Resolution should create separate hierarchies
A card that looks excellent at 1080p may become ordinary at 4K. The GPU load changes with resolution, and the value of VRAM, bandwidth and upscaling also changes.
Ray tracing needs its own ranking
Traditional raster performance and ray-tracing performance can produce different orders. A card that is strong in conventional gaming may not hold the same position with demanding ray-traced settings.
Upscaling and frame generation can also influence the result. Read ray-tracing GPU benchmarks and DLSS 4 vs FSR 4.
Hierarchy rule: never treat one universal rank as the answer for gaming, ray tracing, creator work and value at the same time.
How VRAM changes the hierarchy
Memory capacity can matter more at higher resolutions, with high textures, large mods and creator workloads. A card with more VRAM may become the safer long-term fit even when another card is close in average game performance.
More VRAM does not automatically make a GPU faster. Read 16GB vs 8GB VRAM.
Gaming and creator hierarchies are different
Video editing, 3D rendering and local AI can depend on encoders, APIs, CUDA support, application optimisation and VRAM. A gaming hierarchy should not be reused as a creator ranking.
- Gaming vs creative GPU benchmarks
- Best GPU for video editing Australia
- Best GPU for 3D rendering Australia
- Best GPU for machine learning Australia
Performance hierarchy vs value hierarchy
A performance hierarchy answers which class is faster. A value hierarchy asks how much relevant performance the buyer receives for the current delivered price in AUD.
The two rankings should be separate. Use GPU performance per dollar Australia as the price layer.
Power, thermals and system fit
A higher tier can require a stronger PSU, more case clearance and more cooling. That affects total system cost and may make a lower tier the better real-world purchase.
Where used GPUs fit
Used cards can move up a value hierarchy because depreciation lowers the purchase price. They can also move down because warranty, condition and history are weaker.
How hierarchy pages should be updated
- Use a consistent test system within each benchmark page.
- Separate native, upscaled and generated-frame results.
- Record the game, driver and application version.
- Use multiple games or applications.
- Include low-frame behaviour where available.
- Keep raster, ray tracing and creator rankings separate.
- Add Australian pricing as a separate value layer.
- State whether data is measured or sourced.
Common hierarchy mistakes
- Sorting every GPU by one synthetic score.
- Assuming a newer generation always wins.
- Ignoring the target resolution.
- Mixing ray tracing and raster results.
- Using gaming rankings for creator work.
- Ignoring VRAM and power.
- Using launch prices for current value.
- Applying desktop results to laptop GPUs.
Related MyGPU comparisons
- RTX 5070 vs RX 9070 XT
- RTX 5080 vs RX 9070 XT
- RTX 5060 vs RX 9060 XT
- RTX 5070 Ti vs RTX 5080
- NVIDIA vs AMD comparison
- GPU Comparison Centre
Data and verification policy
This page provides an editorial class framework. Exact current benchmark numbers, driver versions, test dates and prices should be published on the linked benchmark pages and verified immediately before publication.
Final verdict
Use the hierarchy to choose the right performance class, then use dedicated benchmarks and current Australian prices to choose the actual card.
The correct tier is the lowest one that comfortably meets your real monitor, workload and ownership goals.
GPU hierarchy questions
Frequently asked questions
What is a GPU benchmark hierarchy?
A GPU benchmark hierarchy organises graphics cards into practical performance tiers. A useful hierarchy separates resolution, ray tracing, creator workloads, power and price rather than relying on one universal score.
Which GPU tier is best for 1440p gaming?
Premium and mainstream 1440p tiers are the most relevant. The correct choice depends on refresh rate, ray tracing, VRAM, game library and current Australian price.
Can an older GPU rank above a newer GPU?
Yes. Product tier often matters more than generation name. An older higher-tier card can outperform a newer mainstream card, although warranty, efficiency and feature support may favour the newer purchase.
Should ray tracing have a separate hierarchy?
Yes. Ray-tracing performance can differ from traditional raster performance, and upscaling support also changes the buying decision.
How should Australian buyers use a GPU hierarchy?
Use the hierarchy to identify a suitable class, then compare specific models using current delivered prices in AUD, warranty, power, case fit and benchmark results for the games or applications you use.
Next step
Open the benchmark page for your chosen tier
Start with resolution-specific results, then compare ray tracing, creator performance and Australian value.