
Temperature guide
Monitoring and thermal health
How to Monitor GPU Temperature
The easiest way to monitor GPU temperature is to use a hardware-monitoring app or on-screen overlay, check your idle temperature, then watch your core temperature, hotspot temperature and fan behaviour during a real game or workload. Good monitoring is not just seeing one number once. It is comparing idle, load, peak and hotspot behaviour over time.
What matters most: core temperature, hotspot temperature, fan speed, ambient room conditions and whether the temperature stabilises or keeps climbing.
Quick answer
How do you monitor GPU temperature properly?
- Install or open a GPU monitoring app with live sensors and, ideally, an in-game overlay.
- Record the GPU temperature at idle after the PC has been sitting for a few minutes.
- Run a game, benchmark or creative workload that actually stresses the card.
- Watch the core temperature, hotspot temperature, fan speed and whether temperatures stabilise.
- Compare the numbers with your room temperature and your card's fan noise.
- If temperatures look high, check dust, airflow, fan curve and case pressure before assuming the GPU is faulty.
Visual overview
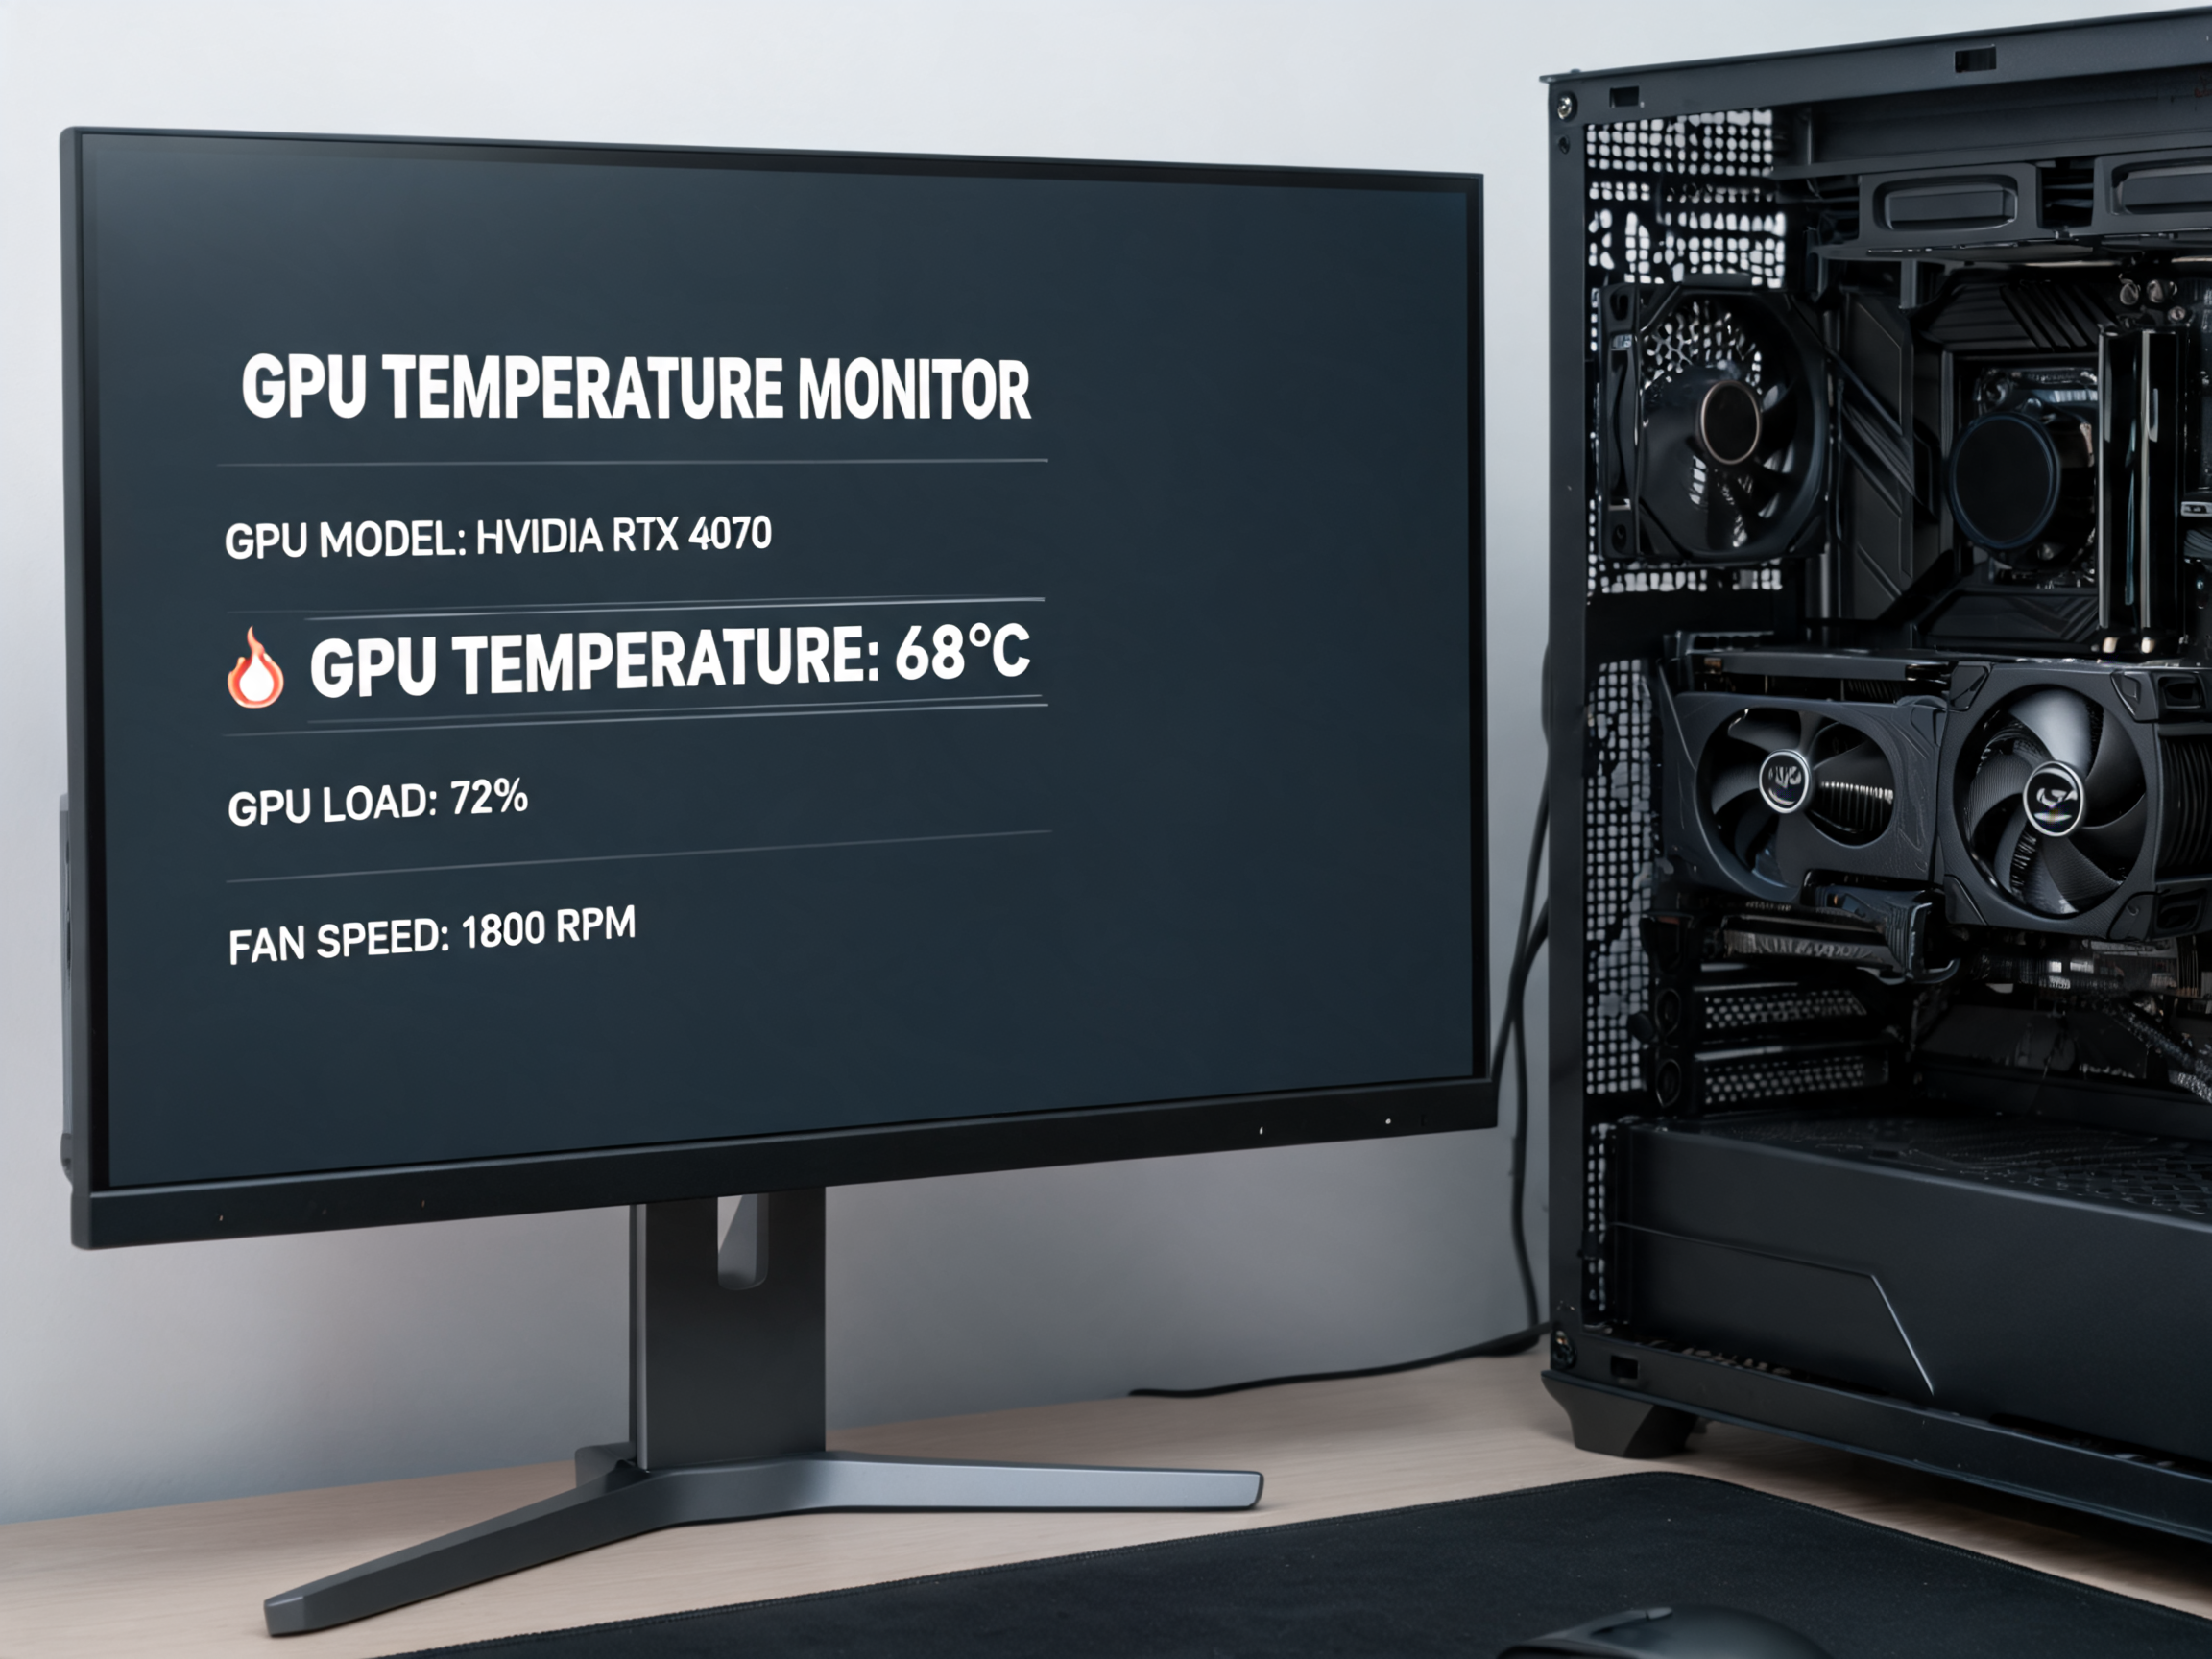
See what a temperature-checking setup looks like
Practical approach
Check at idle, then check under a meaningful load
A desktop temperature alone tells you very little. What you want is a before-and-after picture: idle temperature, then gaming or workload temperature, then peak or hotspot behaviour.
That lets you see whether the GPU is simply warming up normally or whether it is running hotter than expected for your case, room and fan profile.
Try the temperature checkerInteractive thermal checker
Interpret your GPU temperature readings
Enter your idle temperature, load temperature, hotspot temperature and room temperature. The checker will interpret the pattern and update the bars.
Ambient matters because a hotter room naturally pushes GPU temperature up.
Thermal result
Core rangeWaiting for calculation
Hotspot deltaWaiting for calculation
Idle behaviourWaiting for calculation
Ambient deltaWaiting for calculation
Enter your readings
The checker will interpret your temperatures and highlight the most important signal.
Waiting for checkWatch the process
GPU temperature checking video
Watch a full temperature-checking session once, then keep the steps below open when you test your own system. The player includes play, pause, volume, timeline and fullscreen controls.
Video is best used together with the interactive checker and checklist further down the page.
GPU temperature monitoring walkthrough.
Step-by-step guide
How to monitor GPU temperature in a way that actually helps
1
Open a real monitoring tool
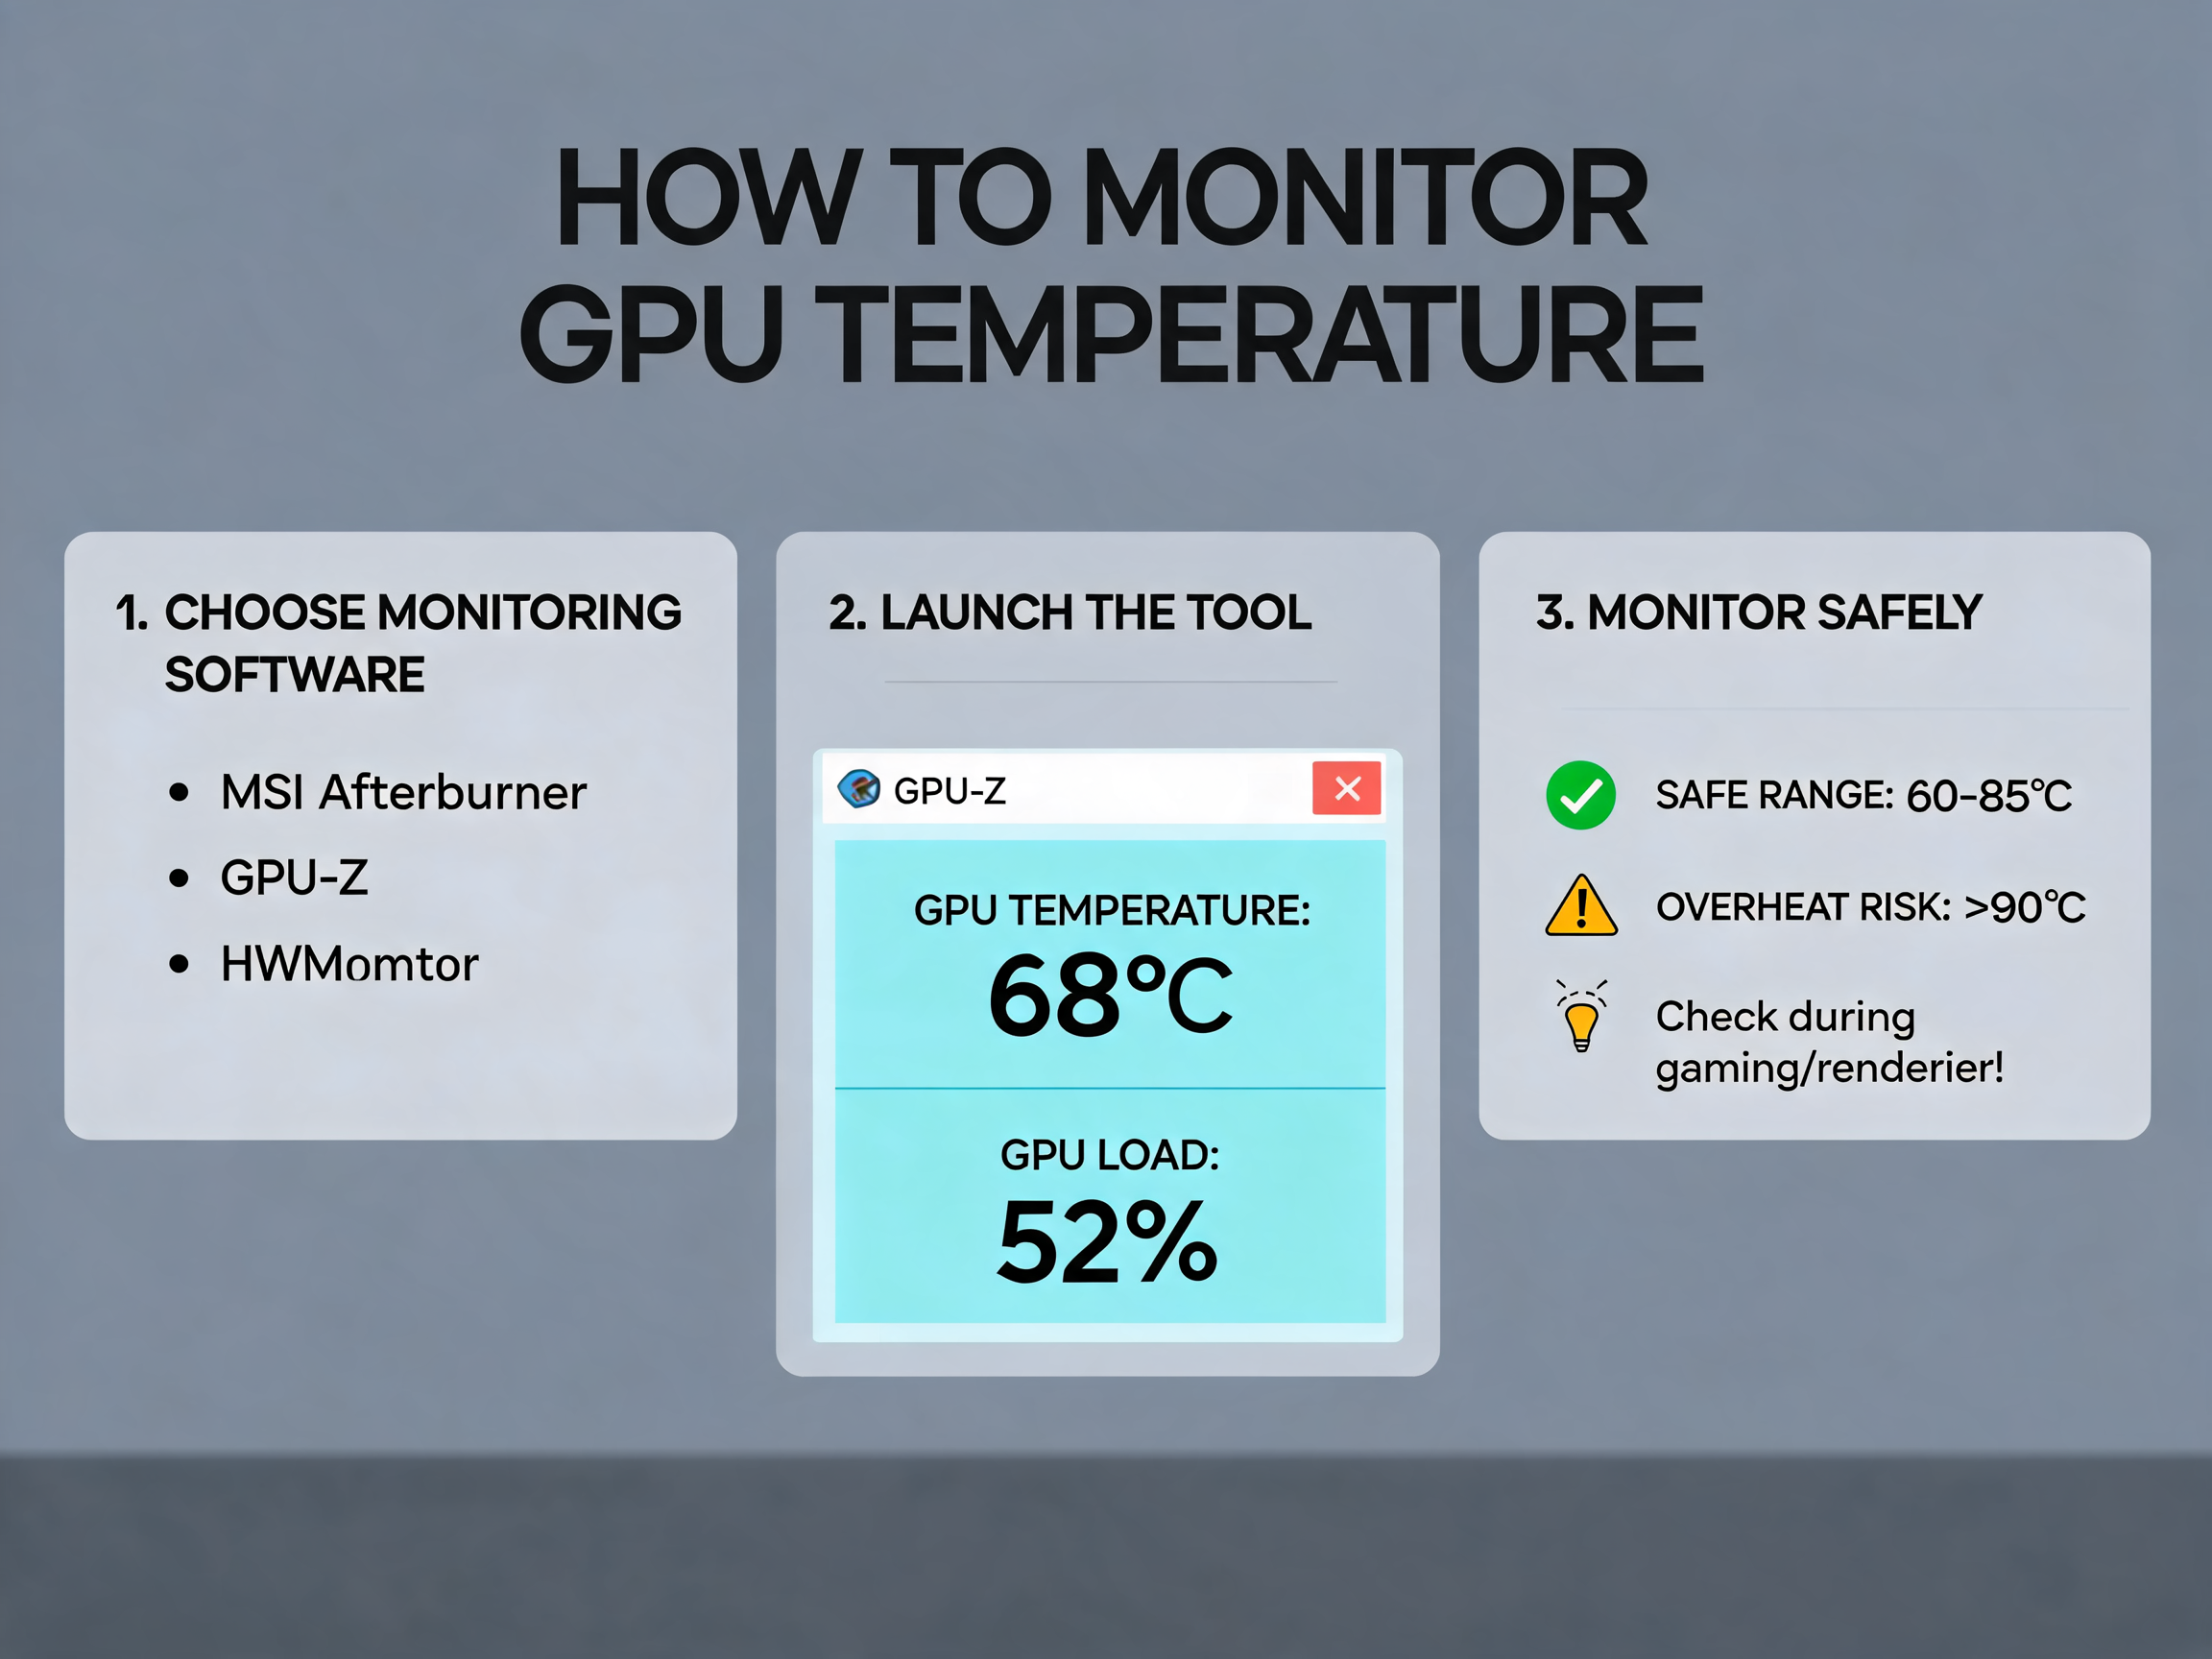
Use a hardware monitor, GPU utility or an in-game overlay that shows at least GPU temperature, hotspot temperature and fan speed. A graph or max-value log is even better because it helps you see peaks instead of guessing from a quick glance.
2
Let the system settle at idle first
After booting and opening the monitoring software, give the PC a few minutes so background activity drops. Record the idle GPU temperature and note whether the fans are off, low or ramping unexpectedly.
3
Run your real game or workload
Use the application that actually matters to you. If you play games, launch the game you use most. If you edit video or render 3D work, monitor during that software. A GPU can look perfectly fine on the desktop and still run hot when genuinely loaded.
4
Watch the trend, not just one snapshot
During the first few minutes, the temperature usually climbs. What matters is whether it stabilises at a normal value or continues trending upward because the cooler, airflow or fan curve is struggling.
5
Compare core temperature with hotspot temperature
The GPU core temperature is important, but hotspot or junction temperature adds context. A reasonable hotspot can be normal even when it looks higher than the core. The bigger clue is how wide the gap is between core and hotspot, especially if the delta becomes unusually large.
6
Repeat after any airflow or fan changes
If you clean dust, improve case airflow, change the fan curve or move the PC into a cooler room, test again the same way. Monitoring is most useful when you compare before and after conditions consistently.
Temperature bands
Common GPU temperature ranges at a glance
Cool idle
Often around 30°C to 40°C in a moderate room with decent airflow.
Normal idle
Frequently around 40°C to 50°C depending on room temperature and fan-stop behaviour.
Normal gaming
Many GPUs operate around 60°C to 85°C during sustained gaming or rendering.
Needs attention
Core temperatures pushing well past the usual gaming range or hotspot temperatures that look excessive deserve inspection.
Core vs hotspot
Why hotspot temperature matters
Core temperature
The main GPU temperature is the number most people watch first. It gives you a broad view of how warm the card is during idle and load.
Hotspot temperature
The hotspot tracks the warmer point on the GPU package. It is expected to read higher than the main core temperature. What matters is whether the number and the gap to core stay within a sensible pattern for the card.
Interactive checklist
Run a full monitoring session without forgetting anything
0%complete
Fix the cause, not just the number
What should you do if temperatures look high?
Suggested action plan
Start with airflow and dust
Check the easiest and most common causes first, then test again under the same workload.
- Clean visible dust from case filters and GPU cooler surfaces.
- Check front intake and rear exhaust airflow.
- Retest with the same game or workload for a clean comparison.
Common monitoring mistakes
What people get wrong when checking GPU temperatures
A cool desktop number does not prove the GPU behaves well once the card is loaded.
Ambient room temperature changes what a normal GPU reading looks like.
Hotspot and fan behaviour provide useful context that a single core temperature cannot.
Different cases, rooms, fan curves and workloads produce different results.
Adjust one variable at a time so you can tell what improved the result.
Many cards are designed to run warmer under load than users expect.
Why monitoring GPU temperature matters
Temperature affects stability, noise, boost behaviour and long-term comfort. A graphics card that stays within a healthy range often maintains more predictable performance and avoids unnecessary fan noise. Monitoring is also one of the fastest ways to spot dust buildup, poor airflow or a room that has simply become too warm for quiet operation.
It is important not to panic over a single number. A reading only becomes useful when you add context: idle versus load, core versus hotspot, and the GPU's behaviour over a complete gaming or workload session.
What is a safe GPU temperature?
Many desktop GPUs operate comfortably in the rough range of 60°C to 85°C during gaming, with idle values often landing around 30°C to 50°C. Hotspot temperatures are typically higher than the main core value, and a higher hotspot is not automatically a fault.
The more important question is whether your card is behaving consistently. A GPU that stabilises at a sensible temperature is different from one that keeps climbing, throttles aggressively or requires extreme fan noise to stay under control.
Helpful rule: check what the temperature does after ten to twenty minutes of a real workload. Stable behaviour is usually more informative than the initial warm-up period.
How often should you check GPU temperature?
You do not need to stare at temperature software all day. The smart times to check are after installing a new GPU, after changing your case airflow, during hotter weather, after cleaning the PC, when fan noise suddenly changes or when performance feels inconsistent.
If your GPU has always been stable and quiet, occasional spot checks are usually enough. If you are tuning airflow or troubleshooting, check more systematically and keep notes.
Idle temperature versus load temperature
Idle temperature shows how the PC behaves when it is doing very little. Load temperature shows how well the cooler, fan curve and case airflow manage heat when the GPU is under sustained demand. A GPU with a slightly warm idle but stable load can be fine. A GPU with a normal idle but runaway load temperatures deserves closer attention.
Should you also monitor fan speed?
Yes. Fan speed helps explain why the temperature looks the way it does. For example, a GPU at 76°C with moderate fan noise may be behaving normally, while a GPU at the same temperature with fans screaming near maximum may suggest airflow or cooler efficiency is under pressure.
Fan speed also helps you judge whether a custom fan curve is working or whether the default profile is already doing enough.
How ambient temperature changes the result
A hotter room pushes every cooling system harder. If your room is much warmer than usual, a higher GPU temperature can still be normal. This is why comparing absolute numbers across different setups is less helpful than comparing your own before-and-after tests under similar conditions.
When should the hotspot delta concern you?
A higher hotspot than core is normal. What deserves attention is a pattern where the hotspot becomes much higher than expected for the card, or where the gap grows unusually large compared with the GPU's normal behaviour. That can point to cooling inconsistency, airflow issues or, in some cases, a cooler-contact problem.
Do not diagnose a hardware fault from one reading alone. Repeat the same test, compare multiple sessions and check airflow, dust and fan behaviour first.
What to do if GPU temperature is too high
- Clean dust from intake filters, case fans and visible cooler surfaces.
- Check whether the case has enough intake and exhaust airflow.
- Make sure the PC is not pushed hard against a wall or enclosed in hot furniture.
- Review the fan curve if your software allows it.
- Retest in the same game or workload for a clean before-and-after comparison.
- If you recently installed the card, confirm it is seated properly and getting unobstructed airflow. See How to Install a GPU.
What should you use to monitor temperature?
Any reliable sensor-monitoring application with live GPU readouts can work. The best options are usually the ones that let you see a history graph or an in-game overlay so you can observe behaviour under real load instead of constantly alt-tabbing.
Once you know the temperatures, pair them with the broader performance context from the GPU Benchmarks Hub or the practical buying and ownership advice in the GPU Guides Hub.
Should you log temperatures over time?
Yes, especially when troubleshooting. A quick log helps you compare results after cleaning the PC, changing case fans or tweaking the fan curve. Logging is useful because memory is bad at small details. A saved max temperature and hotspot reading are more reliable than your impression of whether the system felt hot.
What about laptops?
GPU temperature behaviour in laptops is different because the thermal envelope is tighter. A laptop GPU with the same branding as a desktop card is not the same thermal situation. For that difference in context, see Laptop vs Desktop GPU.
What should you check after fixing airflow?
Repeat the same test under the same conditions. Record idle temperature, load temperature, hotspot temperature and fan speed again. If temperatures improved without unacceptable noise, the change likely helped. If nothing improved, move to the next most likely cause rather than piling on random changes.
Useful related MyGPU guides
- GPU Guides Hub
- GPU Benchmarks Hub
- GPU Electricity Cost Calculator
- GPU Warranty Australia
- How to Install a GPU
Final takeaway
The best way to monitor GPU temperature is to create a repeatable routine: check idle, test under a real load, log core and hotspot temperatures, watch fan behaviour and compare the result after any cooling or airflow changes. When you monitor that way, temperature becomes a useful diagnostic tool rather than a random number that causes stress.
GPU temperature questions
Frequently asked questions
What is a normal GPU temperature while gaming?
Many GPUs commonly run somewhere around 60°C to 85°C while gaming, depending on the card, case airflow, room temperature and fan profile.
What is a normal idle GPU temperature?
Idle temperatures often land around 30°C to 50°C, but the exact number can vary with ambient temperature and fan-stop behaviour.
Should I monitor hotspot temperature too?
Yes. Hotspot adds context to the core temperature and helps you understand how evenly the cooler is handling the load.
Why does my GPU temperature look fine at desktop but high in games?
Because desktop load is minimal. The real test is what happens when the GPU is actually working hard.
Does a hotter room make the GPU run hotter?
Yes. Ambient room temperature directly affects the starting point of the cooling system, which is why summer and enclosed spaces often raise GPU temperatures.
Should I panic if the hotspot is higher than the core temperature?
No. A higher hotspot is expected. What matters more is whether the temperature pattern is stable and whether the core-to-hotspot gap becomes unusually large for the card.
Next step
Checked your temperature? Now check your performance.
Once you know the GPU is running in a healthy range, use MyGPU benchmark guides to understand the performance you should expect from your card.